Auto-generated interface for javascript animations with dat.GUI
Prototype faster, give users control of your web animations / interactions, and see changes in real time with an auto-generated GUI.
Often times when building an animation in webGL or canvas or SVG, it’s nice to add a graphical user interface (GUI) so you can easily move sliders and click buttons to change your variables, and see those changes without having to leave your browser. And it gives non-coders/clients the chance to play around with things see what changes would look like without having to know how to write code, meaning you don’t have to go through dozens of rounds of review to fine-tune an animation. This is a tutorial that shows you how to (semi)automatically build a GUI for your animation using DAT.gui and javascript.
DAT.gui is a javascript GUI library from the Google Data Arts team that facilitates UI building, but each control must be added manually, and often times I’m working with anywhere from tens to hundreds of variables I want to control, which makes adding them to DAT.gui manually a cumbersome prospect. So this is a quick article to help you automate the process!
TLDR: Copy and adapt this gist to your purposes.
This tutorial will assume that all of your variables that you want to control live inside a javascript/JSON object, like the image below:
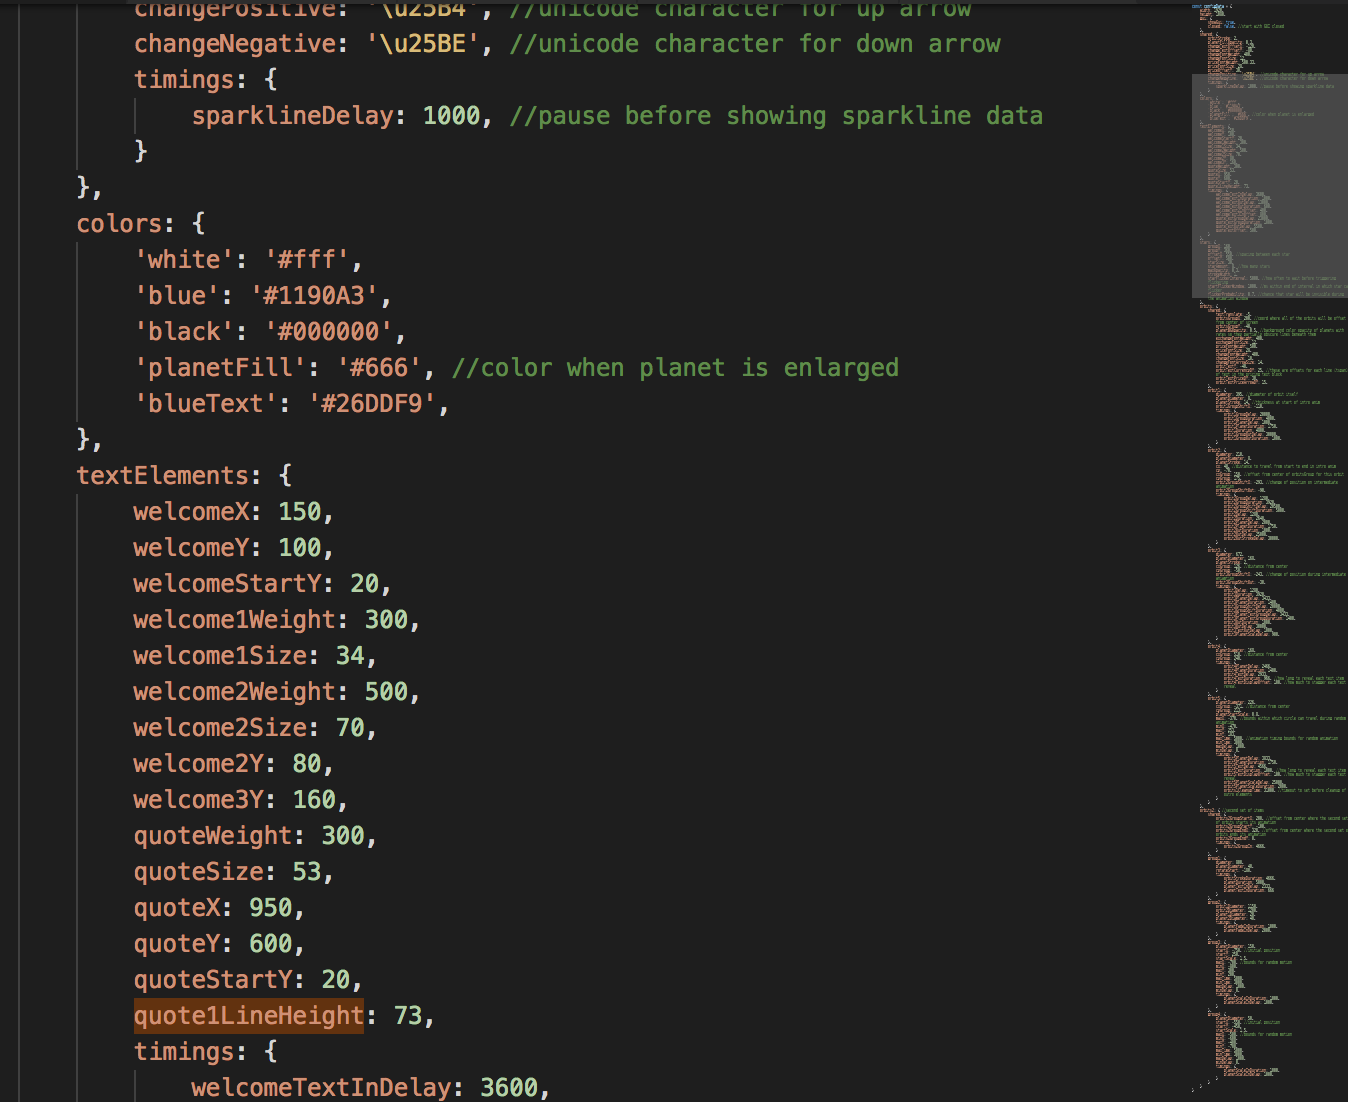
This particular configuration consists of hundreds of variables, which would take forever to add to a GUI manually. Let's speed it up!
First, if you’re not familiar with DAT.gui — their tutorial is short and wonderfully done and will provide a great primer, but here’s a couple terms I’ll be using:
Step — the increment by which each number value will increase or decrease each time you move a slider.
Limit — the max or minimum value a slider can be moved to
To not try and overcomplicate the code, I only have a few rules in place:
- Loop through the top level of the javascript object and read all the values.
- If the object value is a HEX color (like #FFOOOO), then I’ll make sure to use the addColor method vs add so you can use a colorPicker, versus a text field.
- If it’s a string or boolean, just let DAT.gui do it’s thing — it will provide a text field for strings, and a checkbox for booleans.
- If it’s a number between -1 and 1, I’ll set the step to .1 and the limit to -1:1 so each time you move the slider, it will go from .1 to .2 to .3 etc.
- If it’s any other number, I’ll set it’s step to 1 digit less than the number, and it’s limit to 1 digit greater. So, for example, the number 150 would have a step of 10 and a limit of -1000 to 1000 . The number 15would have a step of 1 and a limit of -100 to 100 .
- If it’s a nested javascript object, we’ll loop through that object and find all of its keys, and assign them to the same GUI folder as their parent.
- I’m not currently handling arrays. I could see how these might be useful in a GUI though, as a sort of multiple choice option or dropdown. If you have a good method for handling them, let me know!
Anyway, here is the (pseudo)code:
Some notes:
- You will obviously need to include the DAT.gui javascript file somewhere in your project before you run this code.
- You will need to replace the config object with your own javascript object full of variables you want to be able to control with the GUI. Rather than iterate through a bunch of nested objects, I usually add one folder per 2 levels.
- You’ll see from the screenshot below that the timings nested object just gets wrapped in with all the other variables in the GUI.
- Click to update: Notice that guiUpdate object? For whatever reason, DAT.gui doesn’t have support for buttons, but this object allows you to make one. This button, when pressed, allows you to execute a function. In my case, I’m adding an update function to DAT.gui, when calls the restartAnimation function, which will allow users to restart my animation with all of the changes they made in the GUI.
getNumDigits: this is a function which calls a regex that converts our number to a string and counts how many actual numerical digits are in the number (ignoring things like .)Math.pow(10,numDigits -2): If you have a 3 digit number, like 150, this means that you are taking the number 10, and multiplying it by itself 3-2 times, or 1 time. 10*1 = 10. So that is your step. Each time you move the slider, you increase the number by 10. And as for your limit,Math.pow(10,numDigits) means that 150 has 3 digits, so a limit of 10*10*10 or -1000 to 1000 .
That’s all there is to it. For situations where you have a lot of variables to control with your GUI, hopefully this is helpful!